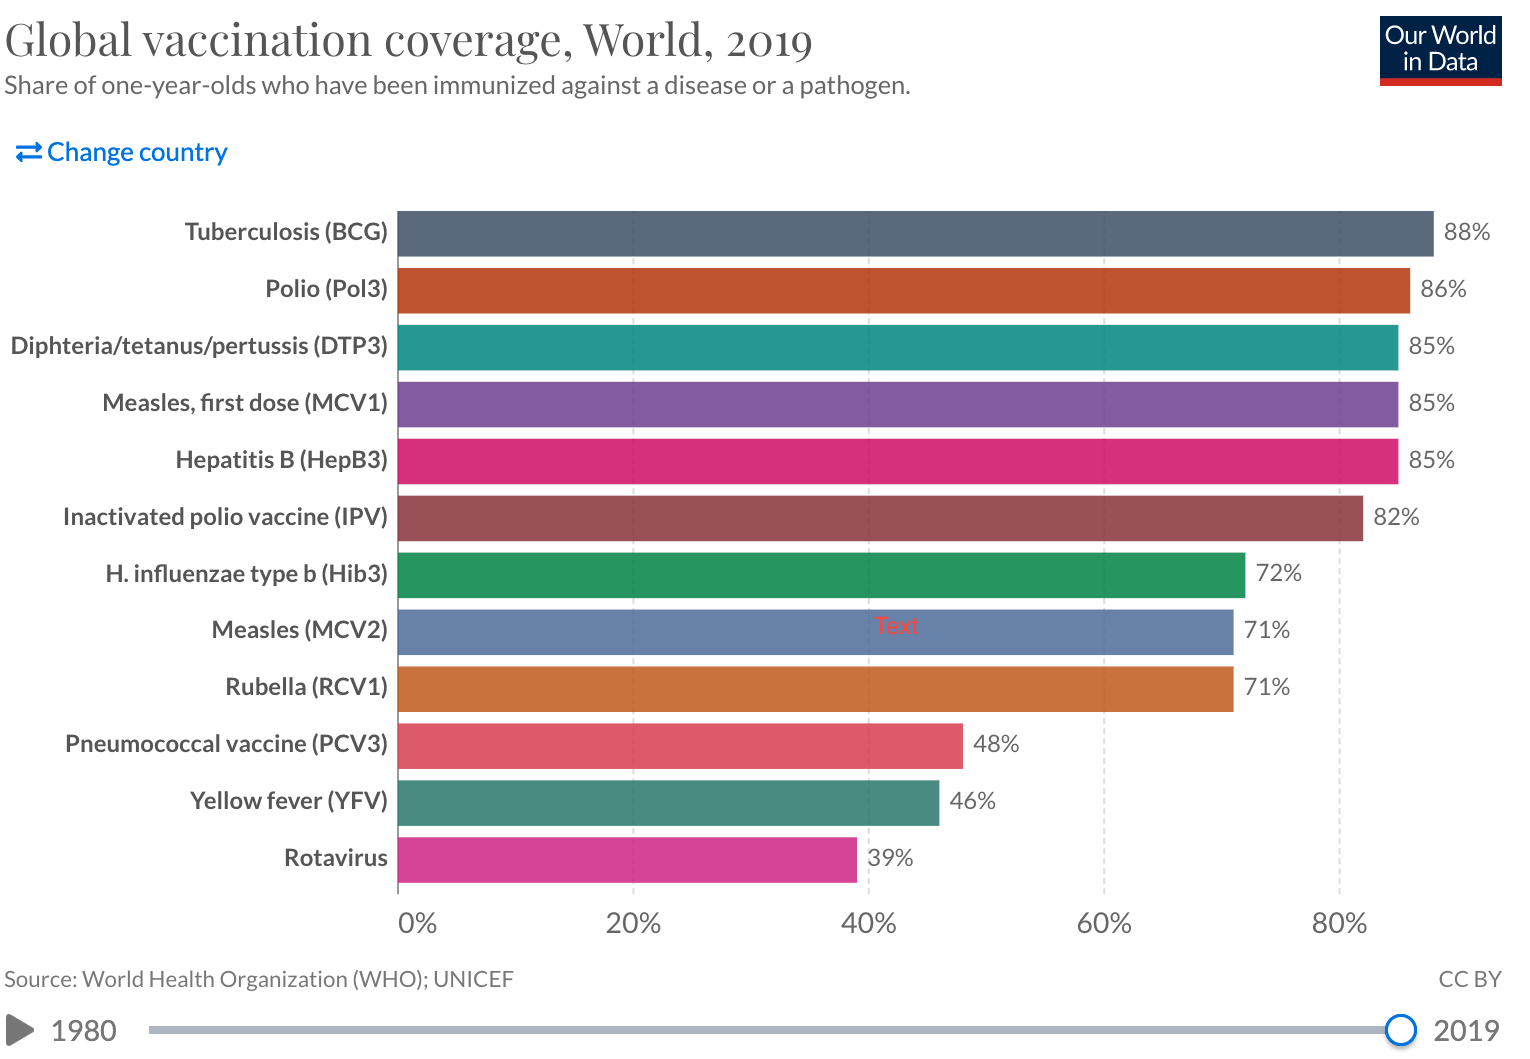
I downloaded the Global Vaccination Coverage data from Our World in Data. I selected this data because it’s interesting to see what vaccines have the highest injection rate since were currently fighting a pandemic.
This is the link to the data.
The following code chunk loads the package I will use to read in and prepare the data for analysis.
- Read the data in
- Use glimpse to see the names and types of the columns
glimpse(global_vaccination_coverage)
Rows: 7,706
Columns: 15
$ Entity                                 <chr> "Afghanistan", "Afgha…
$ Code                                   <chr> "AFG", "AFG", "AFG", …
$ Year                                   <dbl> 1982, 1983, 1984, 198…
$ `BCG (% of one-year-olds immunized)`   <dbl> 10, 10, 11, 17, 18, 2…
$ `HepB3 (% of one-year-olds immunized)` <dbl> NA, NA, NA, NA, NA, N…
$ `Hib3 (% of one-year-olds immunized)`  <dbl> NA, NA, NA, NA, NA, N…
$ `IPV1 (% of one-year-olds immunized)`  <dbl> NA, NA, NA, NA, NA, N…
$ `MCV1 (% of one-year-olds immunized)`  <dbl> 8, 9, 14, 14, 14, 31,…
$ `PCV3 (% of one-year-olds immunized)`  <dbl> NA, NA, NA, NA, NA, N…
$ `Pol3 (% of one-year-olds immunized)`  <dbl> 5, 5, 16, 15, 11, 25,…
$ `RCV1 (% of one-year-olds immunized)`  <dbl> NA, NA, NA, NA, NA, N…
$ `RotaC (% of one-year-olds immunized)` <dbl> NA, NA, NA, NA, NA, N…
$ `YFV (% of one-year-olds immunized)`   <dbl> NA, NA, NA, NA, NA, N…
$ `DTP3 (% of one-year-olds immunized)`  <dbl> 5, 5, 16, 15, 11, 25,…
$ `MCV2 (% of children immunized)`       <dbl> NA, NA, NA, NA, NA, N…
# View(global_vaccination_coverage)
- Use output from glimpse (and View) to prepare the data for analysis
Create the object
regionsthat is list of regions I want to extract from the datasetChange the name of 1st column to Region and the 4th column to Global Vaccination Coverage
Use filter to extract the rows that I want to keep: Year >= 1900 and Region in regions
Select the columns to keep: Region, Year, Global Vaccination Coverage
Use mutate to convert Global Vaccination Coverage to billions of tonnes
Assign the output to regional_vaccines
Display the first 10 rows of regional_vaccines
# regional_vaccines <-
global_vaccination_coverage %>%
  filter(Year ==2019, Entity == "World") %>%
  rename(tuberculosis_bcg = 4, hepatitisb_hepb3 = 5, influenzaeb_hib3 = 6,
  poliovaccine_ipv1 = 7, measles_mcv1 = 8,
  pneumococcal_pcv3 = 9,
  polio_pol3 = 10, rubella_rcv1 = 11, rotavirus_rotac = 12,
  yellowfever_yfv = 13, diphteria_dtp3 = 14, measlesseconddose_mcv2 = 15) %>%
  select(4:15)
# A tibble: 1 × 12
  tuberculosis_bcg hepatitisb_hepb3 influenzaeb_hib3 poliovaccine_ipv1
             <dbl>            <dbl>            <dbl>             <dbl>
1               88               85               72                82
# … with 8 more variables: measles_mcv1 <dbl>,
#   pneumococcal_pcv3 <dbl>, polio_pol3 <dbl>, rubella_rcv1 <dbl>,
#   rotavirus_rotac <dbl>, yellowfever_yfv <dbl>,
#   diphteria_dtp3 <dbl>, measlesseconddose_mcv2 <dbl>
#regional_vaccines
Add a picture.
See how to change the width in the R Markdown Cookbook
Write the data to file in the project directory
write_csv(global_vaccination_coverage, file="global-vaccination-coverage.csv")